C2a: The Scientific Method
Welcome! Science is not just a collection of facts; it’s a process, a way of understanding the world around us. The scientific method is the cornerstone of this process, providing a systematic framework for asking questions and finding answers. In this pre-lab reading, we’ll explore the steps involved in the scientific method, which you’ll apply throughout your biology lab experiences.
1. What is the Scientific Method?
The scientific method is a structured approach to investigation and discovery that aims to explain phenomena in the natural world. It’s an iterative process involving observation, questioning, hypothesizing, predicting, testing, and interpreting results. While often presented as a linear sequence, in practice, it can be more dynamic, with scientists revisiting steps as new information or insights emerge.
Its key purposes are:
- To provide an objective, evidence-based way to understand how things work.
- To minimize bias and ensure that conclusions are supported by data.
- To allow for reproducibility and verification of findings by other scientists.
:max_bytes(150000):strip_icc():format(webp)/scientific-method-p2-373335_V2-01-2f51a3a43c8e4be7900848f13c57eef4.png "The Scientific Method Cycle - Replace with actual image URL") Figure 1: A general model of the scientific method. Note that it’s often a cyclical and iterative process.
Figure 1: A general model of the scientific method. Note that it’s often a cyclical and iterative process.
2. The Steps of the Scientific Method
Let’s break down the typical steps involved:
-
Observation
The process begins with an observation of a phenomenon in the natural world. This could be something you notice directly, something you read about, or even a puzzling result from a previous experiment.
- Example: You observe that plants in one area of your garden seem to grow taller than plants of the same species in another area.
-
Question
Based on your observation, you formulate a specific, answerable question. A good scientific question is typically focused and can be investigated through experimentation.
- Example: “Does the amount of sunlight affect the height of these plants?”
-
Hypothesis
A hypothesis is a proposed, testable explanation for the observed phenomenon. It’s not just a guess; it’s an informed statement based on existing knowledge or preliminary observations.
- Characteristics of a good hypothesis:
- Testable: It must be possible to design an experiment that can support or refute it.
- Falsifiable: It must be possible, in principle, for the hypothesis to be proven false. If a hypothesis cannot be proven false, it’s not scientifically useful.
- Clear and Specific: It should make a clear statement about the expected relationship between variables.
- Example Hypothesis: “Plants that receive more sunlight will grow taller than plants that receive less sunlight.”
- This hypothesis is testable (we can manipulate sunlight and measure height) and falsifiable (if plants with less sun grow taller or there’s no difference, the hypothesis is refuted).
- Characteristics of a good hypothesis:
-
Prediction
A prediction is a statement of the expected outcome of an experiment if the hypothesis is true. It often follows an “If…then…” format.
- Example Prediction: “If plants that receive more sunlight grow taller (hypothesis), then plants grown in full sun for 6 weeks will be taller than identical plants grown in partial shade for 6 weeks.”
-
Experimentation (Testing)
This is where you design and conduct a controlled experiment to test your hypothesis and prediction. A well-designed experiment is crucial for obtaining reliable data. Key components include:
-
Variables:
- Independent Variable: The factor that you, the experimenter, manipulate or change. It’s what you are testing.
- In our example: Amount of sunlight (full sun vs. partial shade).
- Dependent Variable: The factor that you measure in response to changes in the independent variable. It’s the outcome you observe.
- In our example: Plant height.
- Controlled Variables (Constants): All other factors that could potentially affect the outcome of the experiment. These must be kept constant across all experimental groups to ensure that any observed differences in the dependent variable are due to the independent variable.
- In our example: Type of plant, soil type, amount of water, pot size, temperature.
- Independent Variable: The factor that you, the experimenter, manipulate or change. It’s what you are testing.
-
Controls:
- Control Group: A group in the experiment that does not receive the experimental treatment (or receives a standard/baseline treatment). It serves as a baseline for comparison.
- In our example: Plants grown in partial shade (or a defined ‘standard’ low light condition) could be the control group if ‘full sun’ is the experimental treatment.
- Experimental Group(s): The group(s) that receive the experimental treatment (the manipulation of the independent variable).
- In our example: Plants grown in full sun.
- Positive Control (sometimes used): A group where a known positive result is expected. This helps confirm that the experimental setup is working correctly. E.g., if testing a new fertilizer, a positive control might be plants given a well-known effective fertilizer.
- Negative Control (often the ‘control group’): A group where no effect (or a baseline effect) is expected. This helps ensure that any observed effect in the experimental group is due to the treatment and not some other factor. E.g., plants given no fertilizer (placebo) when testing a new fertilizer.
- Control Group: A group in the experiment that does not receive the experimental treatment (or receives a standard/baseline treatment). It serves as a baseline for comparison.
-
Replicates and Sample Size:
- Replicates: Repeating the experiment multiple times or having multiple subjects within each group. This helps ensure that the results are not due to chance and increases the reliability of the findings.
- Sample Size (n): The number of individual units or subjects in each group. A larger sample size generally leads to more statistically robust results.
-
-
Data Collection and Analysis
During the experiment, you systematically collect data on the dependent variable. This data can be quantitative (numerical measurements) or qualitative (descriptive observations).
- Data Recording: Record data accurately and meticulously in a lab notebook or spreadsheet.
- Data Analysis: After collection, data are analyzed, often using statistical methods, to determine if there are significant differences between the experimental and control groups. This helps to objectively assess whether the results support or refute the hypothesis. This may involve calculating means, standard deviations, and performing statistical tests (e.g., t-tests, ANOVA).
 Figure 2: Visualizing data, like with a bar graph, helps in interpreting results.
 -
Conclusion
Based on the analysis of your data, you draw a conclusion:
- Support or Refute Hypothesis: State whether your results support or refute your original hypothesis. It’s important to note that a hypothesis is never “proven” true; it is only supported by the evidence. If data do not support the hypothesis, it may be rejected or modified.
- Explain Results: Discuss what your results mean in the context of your question and existing knowledge.
- Acknowledge Limitations: Identify any potential sources of error or limitations in your experimental design.
- Suggest Future Work: Propose further questions or experiments that arise from your findings. Science is an ongoing process!
Watch this video for an overview of the Scientific Method:
3. Variables and Controls: The Heart of Experimentation
Understanding variables and controls is critical for designing valid experiments.
- Independent Variable: The cause or the factor being tested. You change this.
- Dependent Variable: The effect or the outcome being measured. This responds to the change.
- Controlled Variables: Factors kept constant to ensure a fair test.
 Figure 3: A simplified experimental setup. Identifying variables and controls is key.
Why are Controls So Important?
Control groups provide a baseline against which the effects of the experimental treatment can be measured. Without controls, it’s impossible to determine if the observed changes are due to the independent variable or some other confounding factor.
- Negative Control: Helps rule out other factors and shows the baseline state.
- Example: In a fertilizer experiment, plants receiving no fertilizer serve as a negative control.
- Positive Control: Confirms the experiment is working as expected and can produce a known effect.
- Example: If testing a new antibiotic, a known effective antibiotic could be used as a positive control against a bacterial culture.
Watch this video for a deeper dive into Variables:
4. The Iterative Nature of Science
The scientific method is not a one-shot deal. The conclusion of one experiment often leads to new observations, new questions, and revised hypotheses. This cyclical process drives scientific progress. If a hypothesis is consistently supported by multiple experiments, it may become part of a larger theory. A scientific theory is a well-substantiated explanation of some aspect of the natural world, based on a body of facts that have been repeatedly confirmed through observation and experiment.
5. Reproducibility and Peer Review
- Reproducibility: A cornerstone of science. An experiment should be described in enough detail that another researcher can repeat it and obtain similar results. This helps validate findings.
- Peer Review: Before scientific findings are published in reputable journals, they undergo a process called peer review. Other experts in the same field critically evaluate the research (methodology, analysis, conclusions) for validity, significance, and originality. This helps maintain the quality and integrity of scientific literature.
6. Putting It All Together: A Simple Example
Let’s revisit our plant growth example:
- Observation: Plants in sunny areas seem taller.
- Question: Does more sunlight cause these plants to grow taller?
- Hypothesis: Plants exposed to more sunlight will grow taller due to increased photosynthesis.
- Prediction: If plants exposed to 8 hours of direct sunlight daily are compared to identical plants exposed to only 4 hours of direct sunlight daily (all other conditions equal), then after 4 weeks, the plants receiving 8 hours of sunlight will show a greater average increase in height.
- Experiment:
- Independent Variable: Amount of daily sunlight (8 hours vs. 4 hours).
- Dependent Variable: Increase in plant height (cm) after 4 weeks.
- Controlled Variables: Plant species, pot size, soil type, initial plant size, water amount, temperature, humidity.
- Experimental Group: Plants receiving 8 hours of sunlight.
- Control Group: Plants receiving 4 hours of sunlight.
- Replicates: Use 10 plants in each group.
- Data Collection & Analysis: Measure height weekly for all 20 plants. Calculate average height increase and standard deviation for each group. Perform a t-test to see if the difference is statistically significant.
- Conclusion:
- If plants with 8 hours of sun grew significantly taller: The hypothesis is supported. “The results indicate that increased sunlight exposure leads to greater height in this plant species, likely due to enhanced photosynthesis.”
- If no significant difference or 4-hour plants grew taller: The hypothesis is not supported. “The results do not support the hypothesis that more sunlight leads to greater height under these conditions. Other factors may be more influential, or the range of sunlight tested was not optimal.” Further investigation is needed.
This framework will guide your experiments in this lab course, helping you think like a scientist!
Quick Check:
7. Scientific method example: Failure to toast
Let’s build some intuition for the scientific method by applying its steps to a practical problem from everyday life.
-
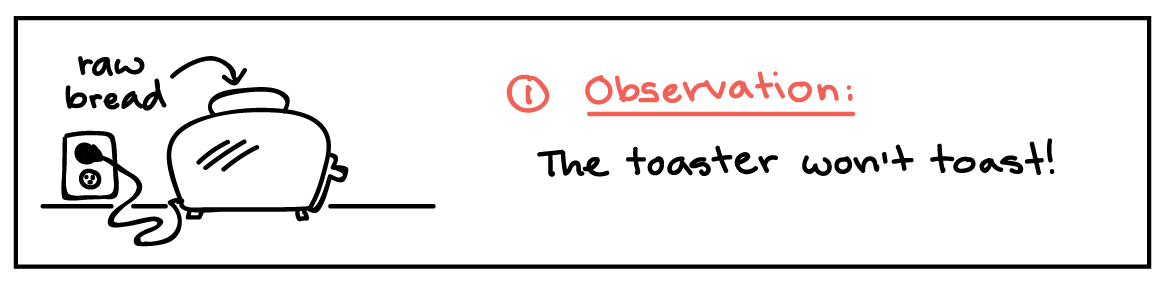
Make an observation
Let’s suppose that you get two slices of bread, put them into the toaster, and press the button. However, your bread does not toast.
Observation: the toaster won’t toast.
-
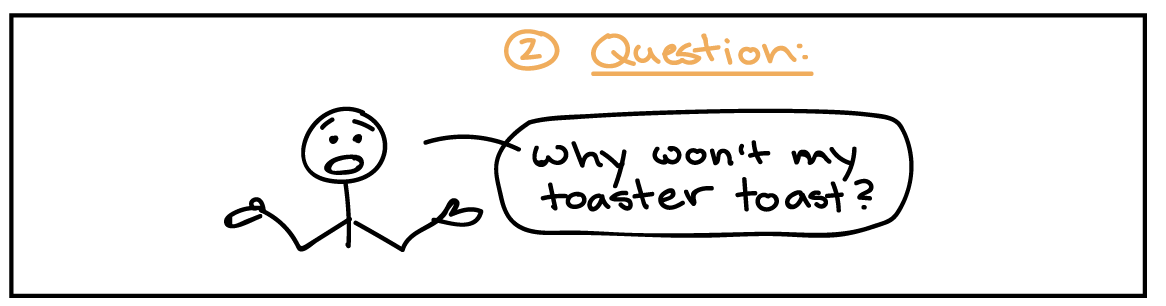
Ask a question
Why didn’t my bread get toasted?
Question: Why won’t my toaster toast?
-
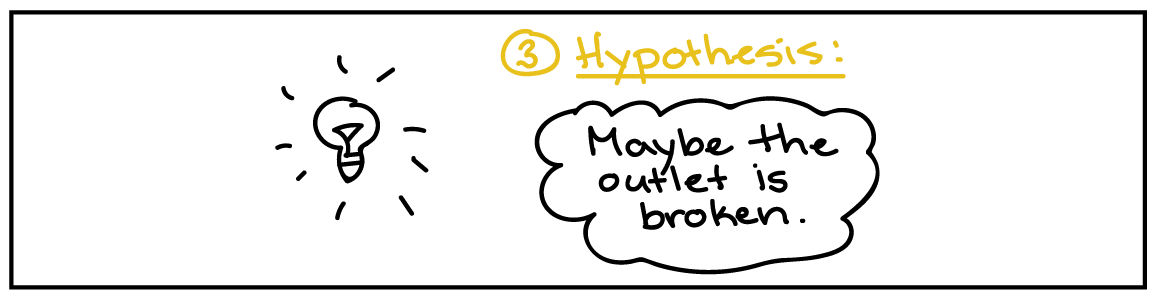
Propose a hypothesis
A hypothesis is a potential answer to the question, one that can somehow betested. For example, our hypothesis in this case could be that the toast didn’t toast because the electricaloutlet is broken.
Hypothesis: Maybe the outlet is broken.
This hypothesis is not necessarily the right explanation. Instead, it’s a possible explanation that we cantest to see if it is likely correct, or if we need to make a new hypothesis.
-
Make predictions
A prediction is an outcome we’d expect to see if the hypothesis is correct. In this case, we might predict that if the electrical outlet is broken, then plugging the toaster into a different outlet should fix the problem.
Prediction: If I plug the toaster into a different outlet, then it will toast the bread.

-
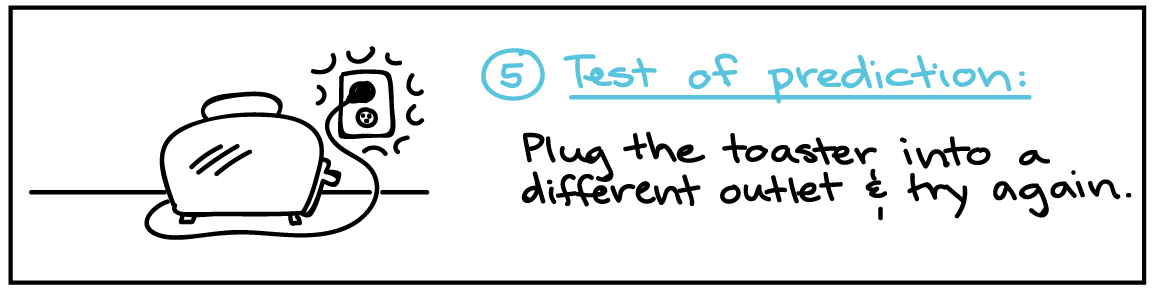
Test the predictions
To test the hypothesis, we need to make an observation or perform an experiment associated with the prediction. For instance, in this case, we would plug the toaster into a different outlet and see if it toasts.
Test of prediction: Plug the toaster into a different outlet and try again.
- If the toaster does toast, then the hypothesis is supported—likely correct.
- If the toaster doesn’t toast, then the hypothesis is not supported—likely wrong.
The results of a test may either support or contradict—oppose—a hypothesis. Results that support a hypothesis can’t conclusively prove that it’s correct, but they do mean it’s likely to be correct. On the other hand, if results contradict a hypothesis, that hypothesis is probably not correct. Unless there was a flaw in the test—a possibility we should always consider—a contradictory result means that we can discard the hypothesis and look for a new one.
-
Iterate
The last step of the scientific method is to reflect on our results and use them to guide our next steps. And the result is:
- Left panel: My bread toasts! Hypothesis is supported.
- Right panel: My bread still won’t toast. Hypothesis is not supported.
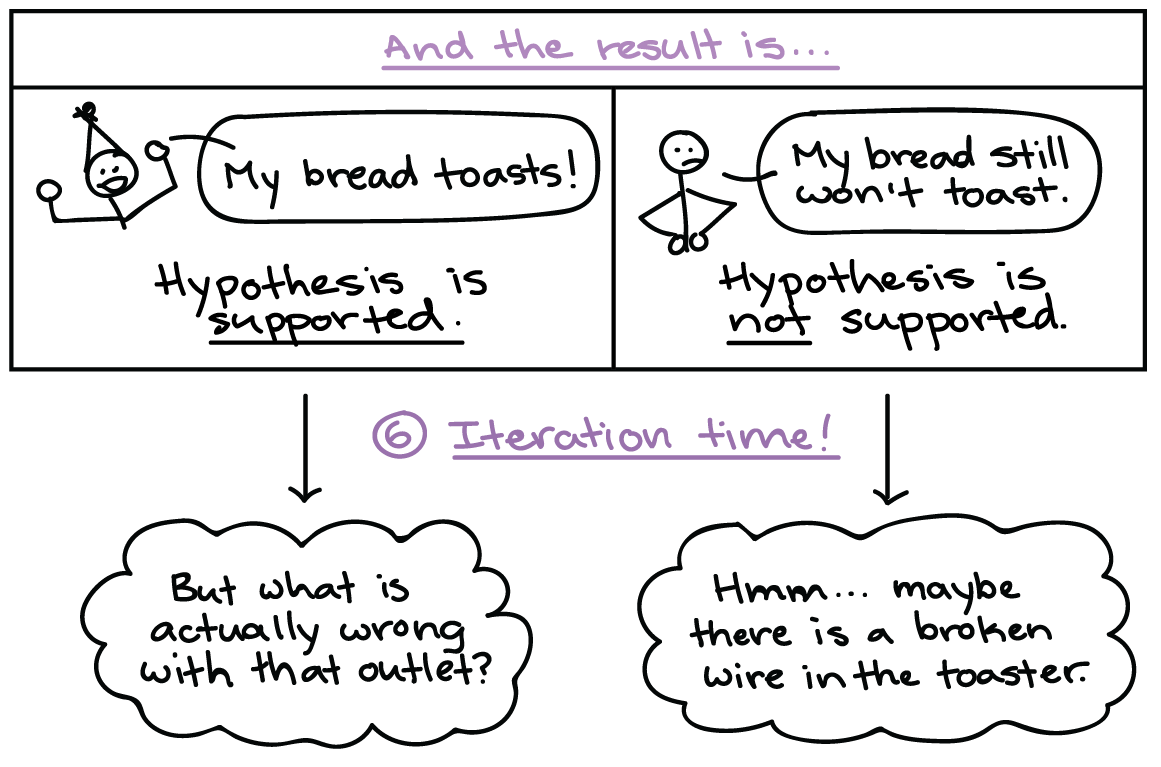
If the hypothesis was supported, we might do additional tests to confirm it, or revise it to be more specific. For instance, we might investigate why the outlet is broken.
If the hypothesis was not supported, we would come up with a new hypothesis. For instance, the next hypothesis might be that there’s a broken wire in the toaster.
In most cases, the scientific method is an iterative process. In other words, it’s a cycle rather than a straight line. The result of one go-round becomes feedback that improves the next round of question asking.
- Resources
- API
- Sponsorships
- Open Source
- Company
- xOperon.com
- Our team
- Careers
- 2025 xOperon.com
- Privacy Policy
- Terms of Use
- Report Issues